Overview
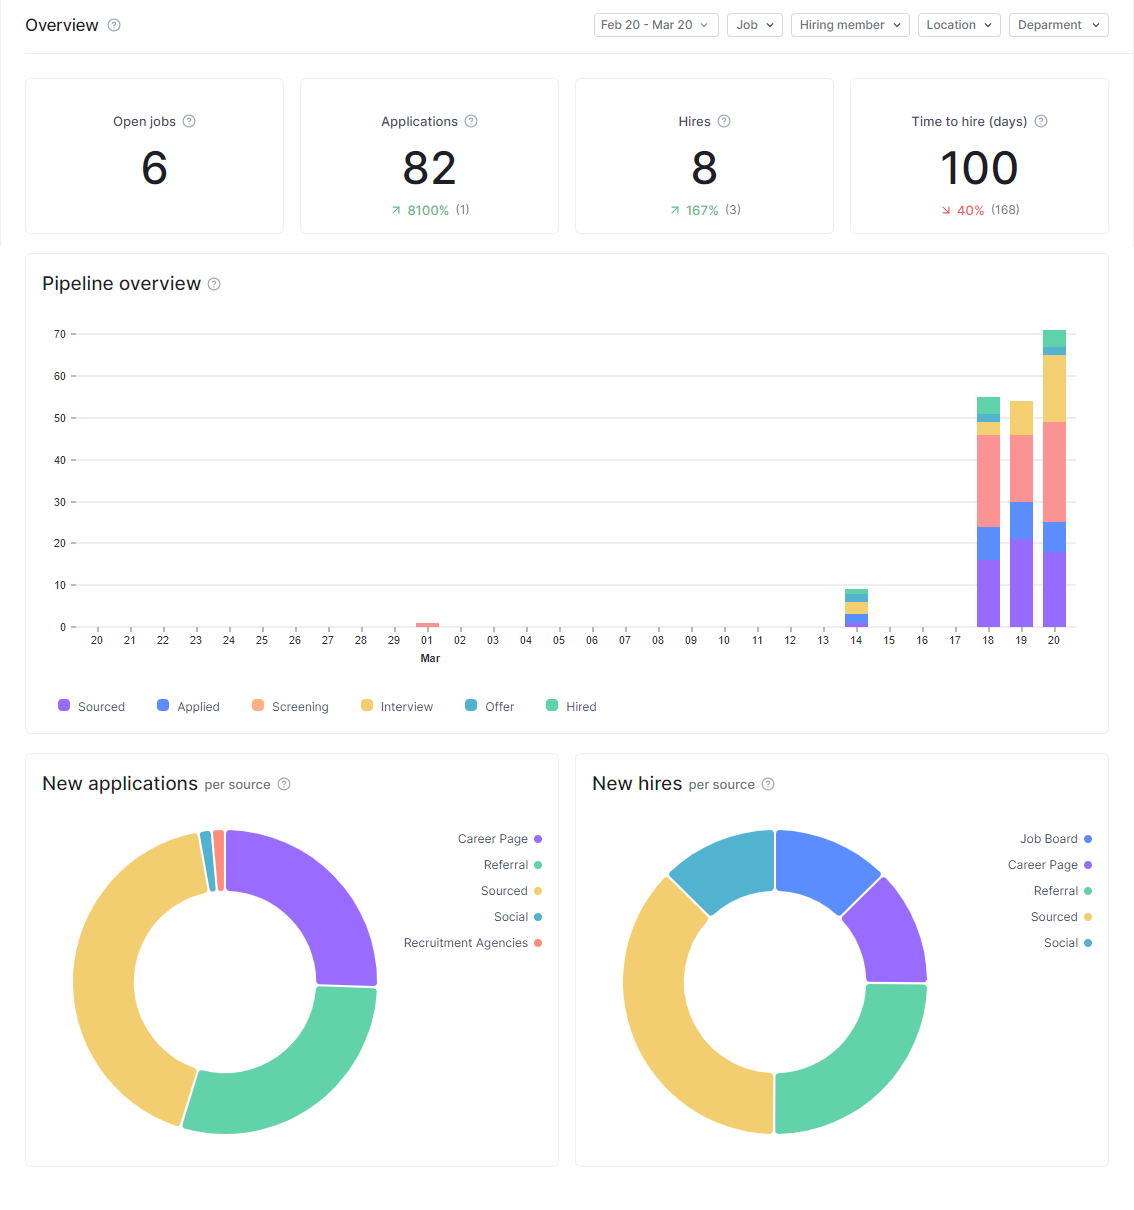
Overview tab in Report will display the key metrics to help you overview your effort.
Numeric

Depending on your filter, the metric will show relevant data and will compare the selected metrics to the data from the previous corresponding period (if any)
Open jobs
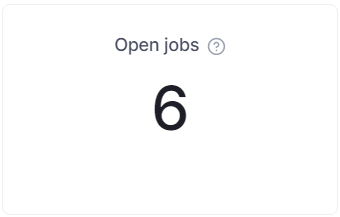
The total number of jobs published within the selected time range. This count reflects the date the job became visible to applicants, not the date it was initially created.
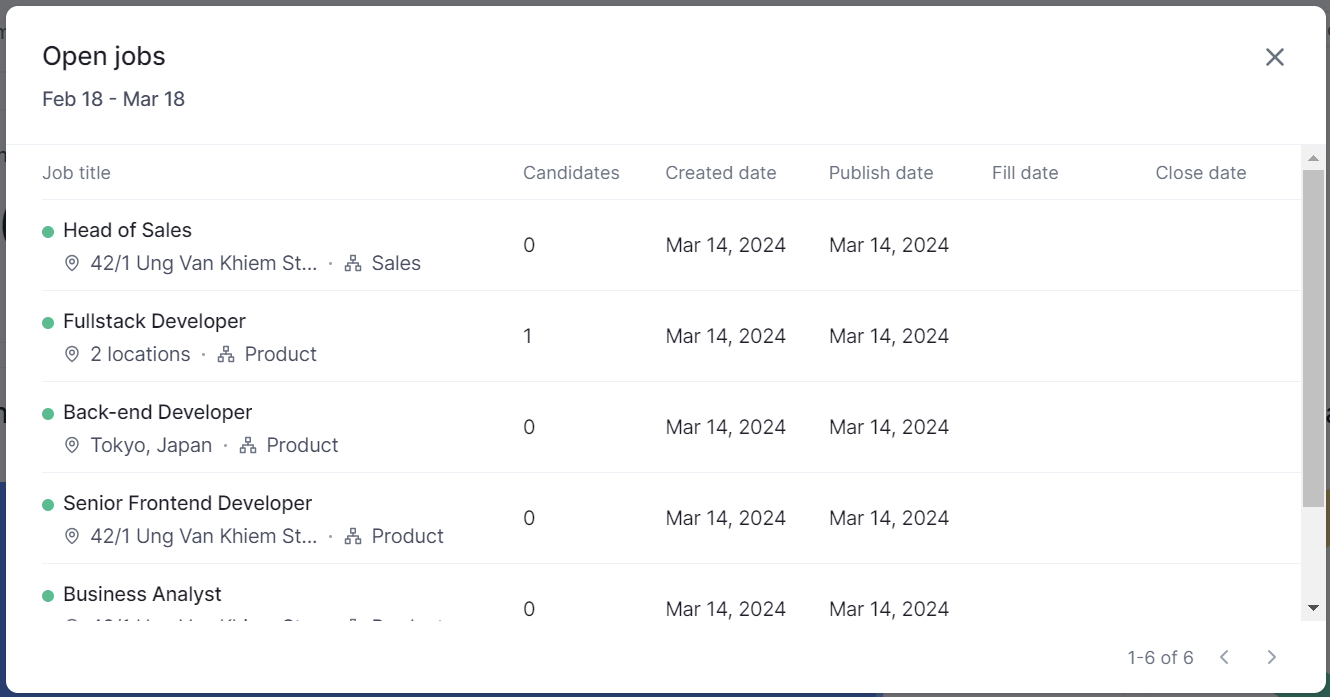
For details on Open jobs, click the numeric value, and a table will display the information:
Job Title: The Title of Job
Candidate: Total candidates are in the Job's hiring pipeline
Create date: The specific date when the job was first created in the Hireforce
Publish date: The date when the job is officially made public and visible to candidates with Internal or Published status.
Fill date: The date that the job is successfully filled by the first qualified candidate who has moved to the Hire Stage.
Close date: The date that a job is changed status to Archive
Applicants
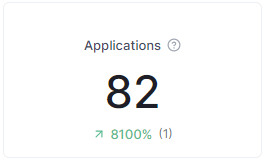
This metric represents the number of applicants who enter your hiring pipeline (New Stage), which includes both Applied or Sourced stage within the chosen time range. Note: Based on applicants who moved to the Hire stage within the selected time range.
For details on Applicants, click the numeric value, and a table will display the information:

Name: The full name of the candidate applying for the job.
Job: The specific job title that the candidate is applying for.
Stage: The current status of the candidate within the hiring process.
Source: The channel or platform where the candidate found the job opening.
Start Process: The date the candidate's application was sourced or applied into the Job on Hireforce.
Hired Date: is the date that the candidate has hired.
Time to Hire: Measures the number of days it takes to hire the candidate from the date a candidate enters the hiring pipeline (Start Process date) to the date that the candidate has moved to Hire stage (Hired date)
Hires
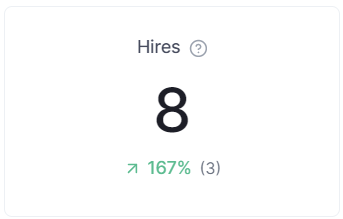
Hire
This metric calculates amount candidate to the Hire stage
Note: Based on applicants who moved to the Hire stage within the selected time range.
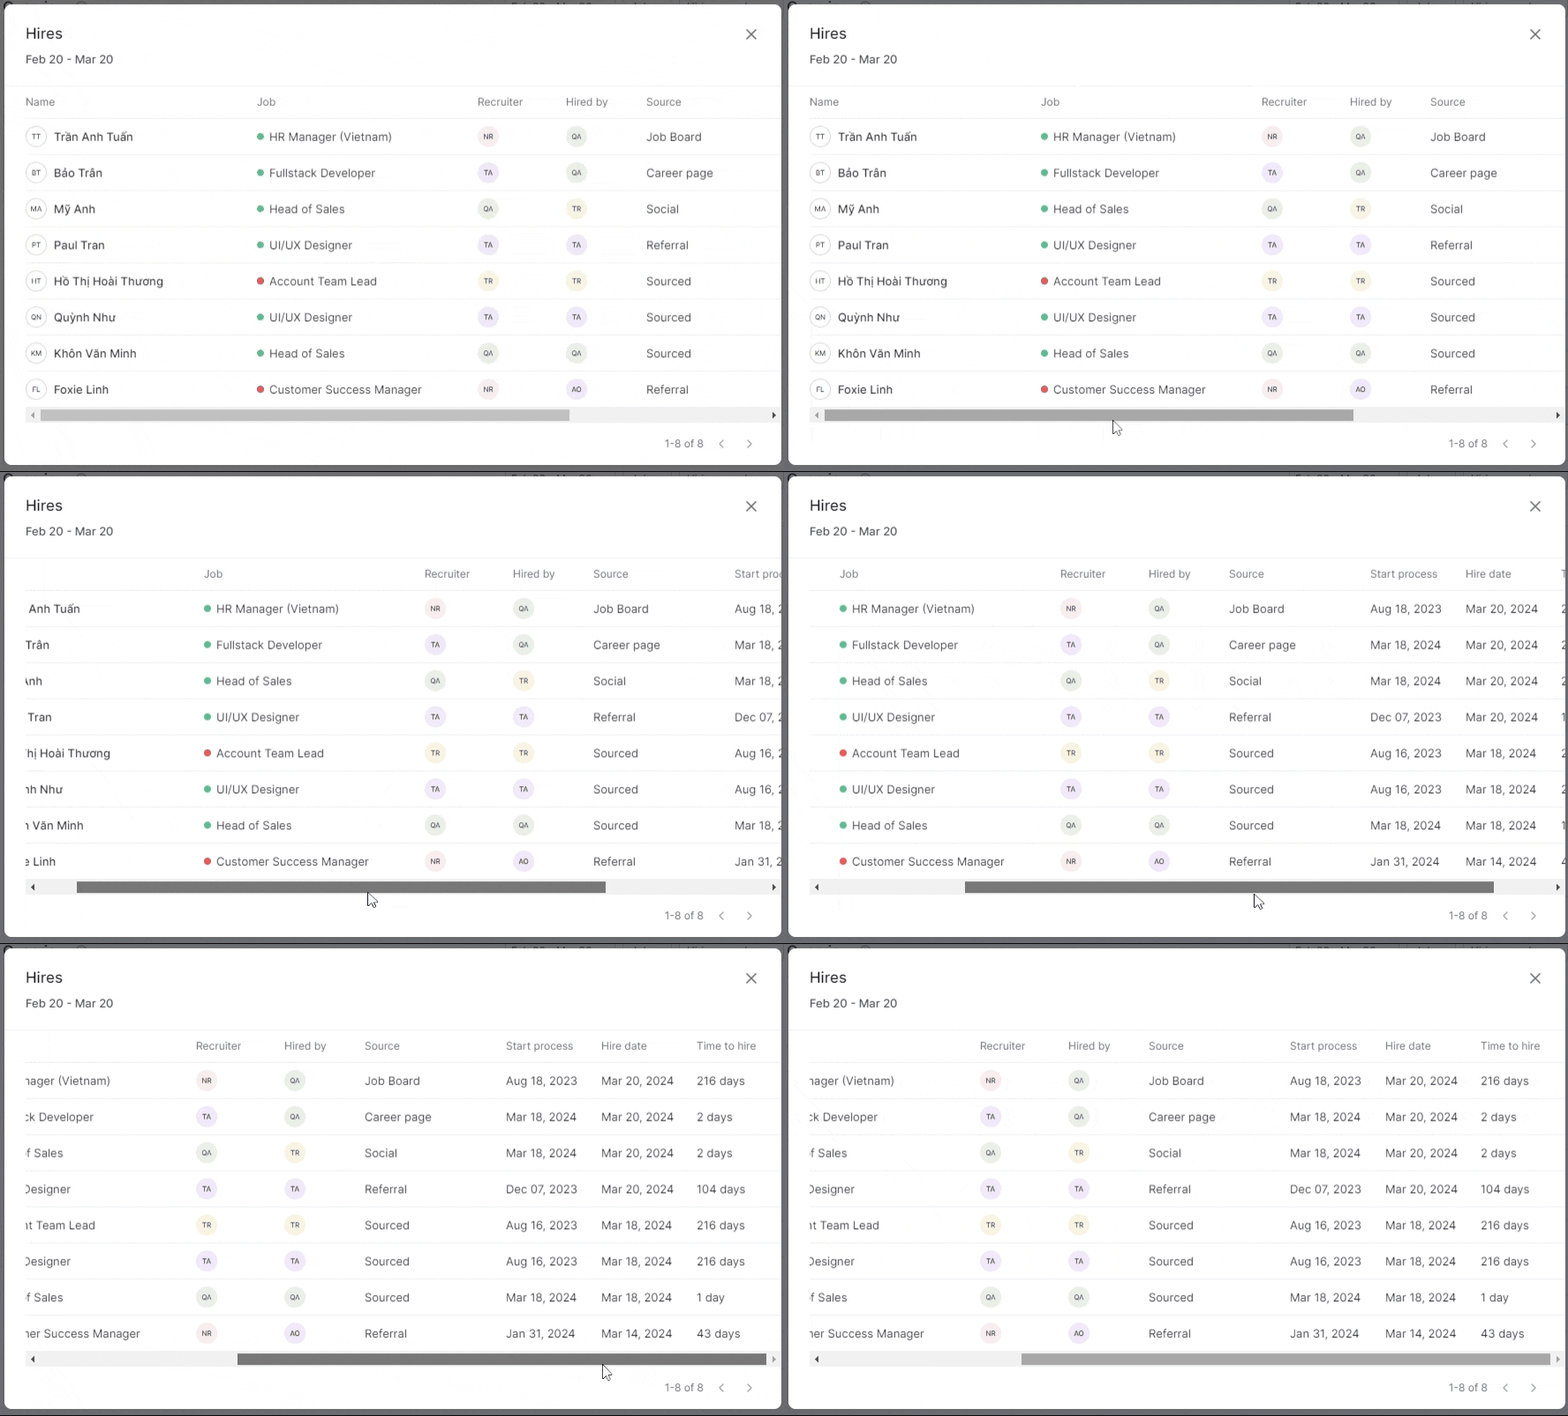
For details on Hires, click the numeric value, and a table will display the information. In addition to the information above, Hires also displays data related to:
Recruiter: Acts as the central point of contact for the hiring process. They source and identify potential candidates, screen resumes, schedule interviews, and manage communication with candidates. They may also be involved in the negotiation of job offers (depending on the organization).
Hire by, Hire date is updated in "Make as hired" pop-up
Time to hire
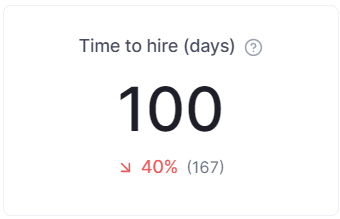
Time to hire
It reflects the average number of calendar days, it takes for a candidate to enter your hiring pipeline and get hired (date of moving to the "Hired" stage).
Note: Based on applicants who moved to the Hire stage within the selected time range.
For details on Time to hire, click the numeric value, and a table will display the relevant information:

Pipeline Overview
This chart shows the number of applicants who have passed through the stages of the hiring pipeline during the filtering period.
If the filtering period is:
Less than 30 days, the chart will show the data by day
Between 30 and 59 days, the chart will show the data by week
More than 90 days, the chart will show the data on by month
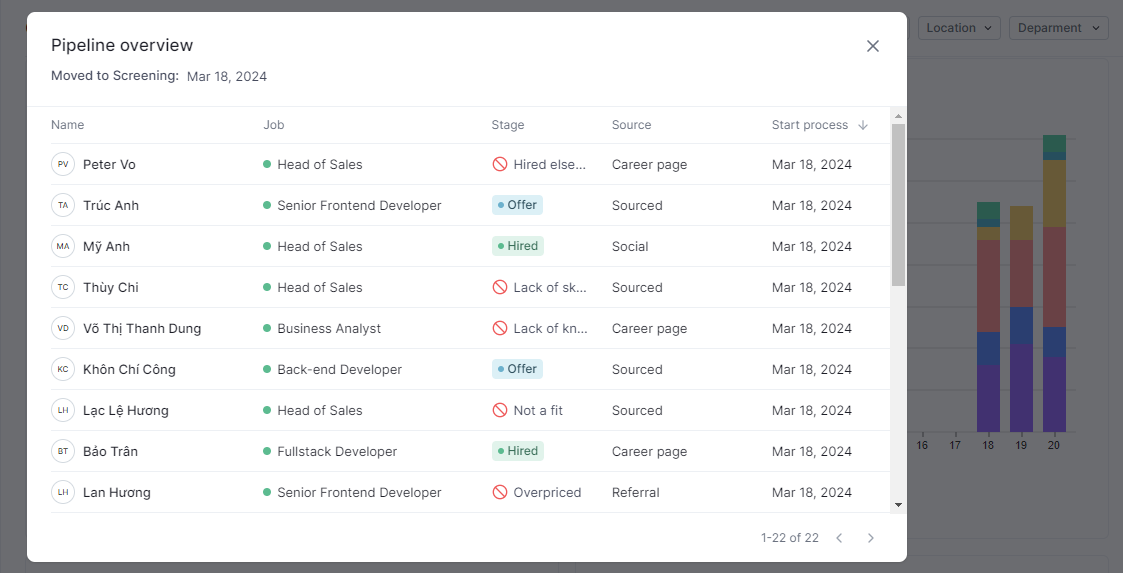
Clicking on a stage from each column in the chart, it will display a table with detailed information about the candidates who have gone through or are currently in that stage.
